
首页 >Business >HPP >Comparative Test Data for the Precision Motion Stage

Comparative Test Data for the Precision Motion Stage

HPP案例.jpg


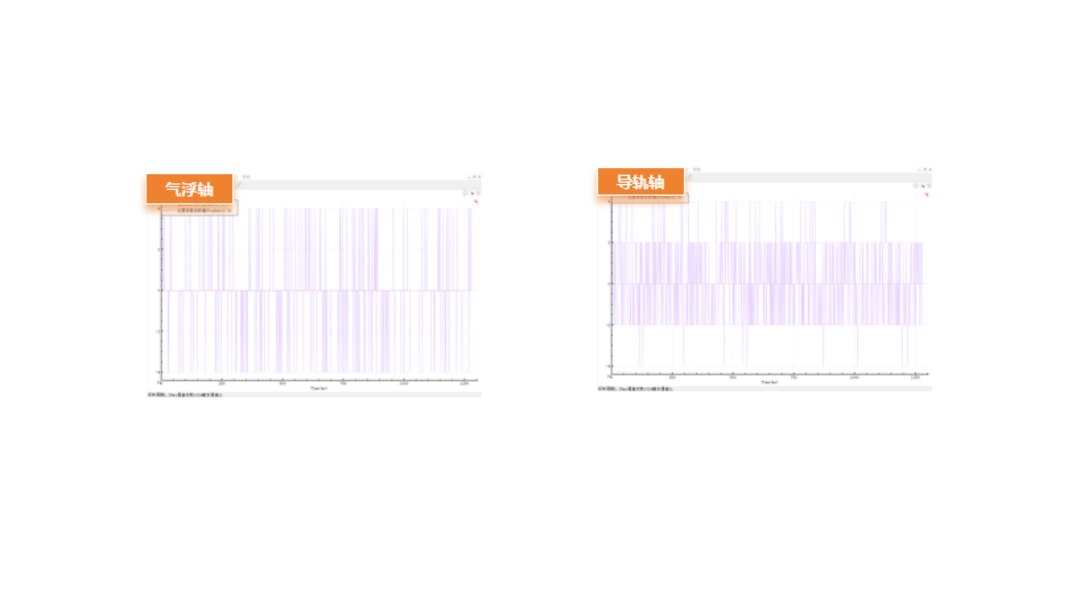
Air-Bearing Axis Test

One measurement point was taken at 15 mm intervals, and the static following-error curve was recorded at 10 measurement points.


Linear Guide Axis Test

One measurement point was taken at 20 mm intervals, and the static following-error curve was recorded at 10 measurement points.


Test Data

The test results are expressed in pulses. Each pulse corresponds to a positioning resolution of 4 nm in the servo drive.


Air-Bearing Axis Test Results

Across all 10 measurement points, the vast majority of errors were within ±5 pulses (±20 nm), with occasional deviations reaching ±7 pulses (±28 nm).


Linear Guide Axis Test Results

Across all 10 measurement points, the vast majority of errors were within ±4 pulses (±16 nm), with occasional deviations reaching ±5 pulses (±20 nm).


Conclusion

Both axes achieved a static following error of less than ±30 nm, meeting the specified requirement. The lower linear-guide axis demonstrated slightly lower following error than the upper air-bearing axis.


Tel:13040689690
Address: Room 1703A, Building 4, Tianna Business Hub, No. 500 Jianyun Road, Pudong New Area, Shanghai
Email: sales@sense-shanghai.com
   marketing@sense-shanghai.com